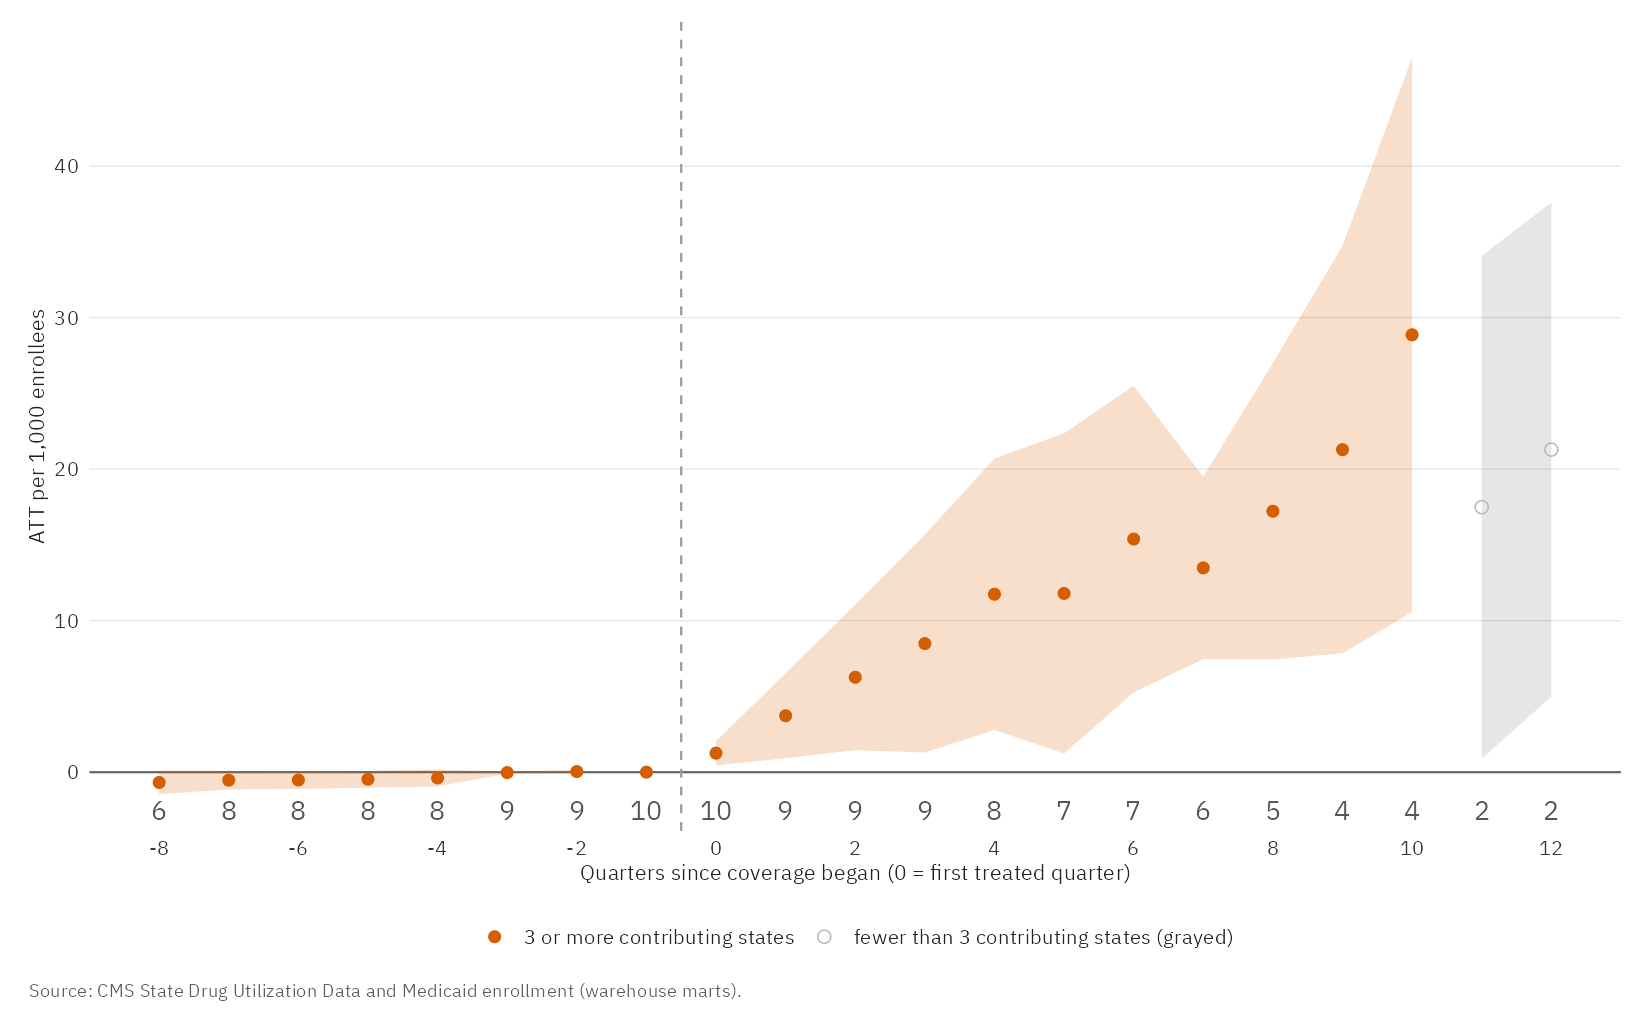
12.2estimated additional prescriptions per 1,000 enrollees per quarter95% CI 8.4 to 16.0; 10 covering vs 34 never-covering jurisdictions
128.8 millionU.S. adults meet the FDA label criteria (lower bound)95% CI 117.2 to 140.3 million; NHANES 2021-2023
$161.3 millionfive-year net cost, 1 million enrollees (central case)$2.69 per enrollee per month; scenario range $55.6 to $369.4 million; rebate assumed
What I did
- Public data
- PostgreSQL
- dbt: 54 models, 126 tests
- R analysis
- Quarto and Shiny
Sources: Medicaid State Drug Utilization Data and enrollment, Medicare Part D, NHANES, MEPS, Open Payments.
Methods shown
Causal inference (staggered difference-in-differences) · survey epidemiology · budget impact modeling with probabilistic sensitivity analysis · claims-derived data engineering (NDC, ICD-10, dbt) · market access insight.
What this shows
- Coverage was associated with an estimated rise from 1.3 to 17.2 prescriptions per 1,000 enrollees per quarter over eight quarters; the estimate holds in all 15 estimable alternative analyses.
- About 17.8 million adults with Medicaid, and 128.8 million U.S. adults overall, meet the label criteria (lower bound).
- In 2024 cardiology wrote 14.5% of Wegovy's Part D claims against 1.2% of Ozempic's (details in the report).
- Coverage works through managed care, in South Carolina and Rhode Island above all (see the report).
- The rebate is the largest unknown in the budget: the central case uses 51.2%, between 23.1% and 79.3%.
Data and notebooks
- Coverage criteria table (CSV): prior authorization, BMI threshold, comorbidity requirement and step therapy for the 17 covering states, with sources.
- Key numbers (CSV): every number in the report, deck and this page, with its source file and row.
- Exploration notebooks: A data layer · B eligible population · C coverage study · D prescribers · E budget impact.
Budget model
The interactive budget model is a decision tool built around this project: set the plan size, uptake, prior authorization and price, then see the five-year net cost, its sensitivity drivers and a probabilistic range. Its defaults equal the numbers on this page. The scenarios are also in a PDF. The design pack for primary research is here.