Oncology real-world evidence · Synthetic vs real data
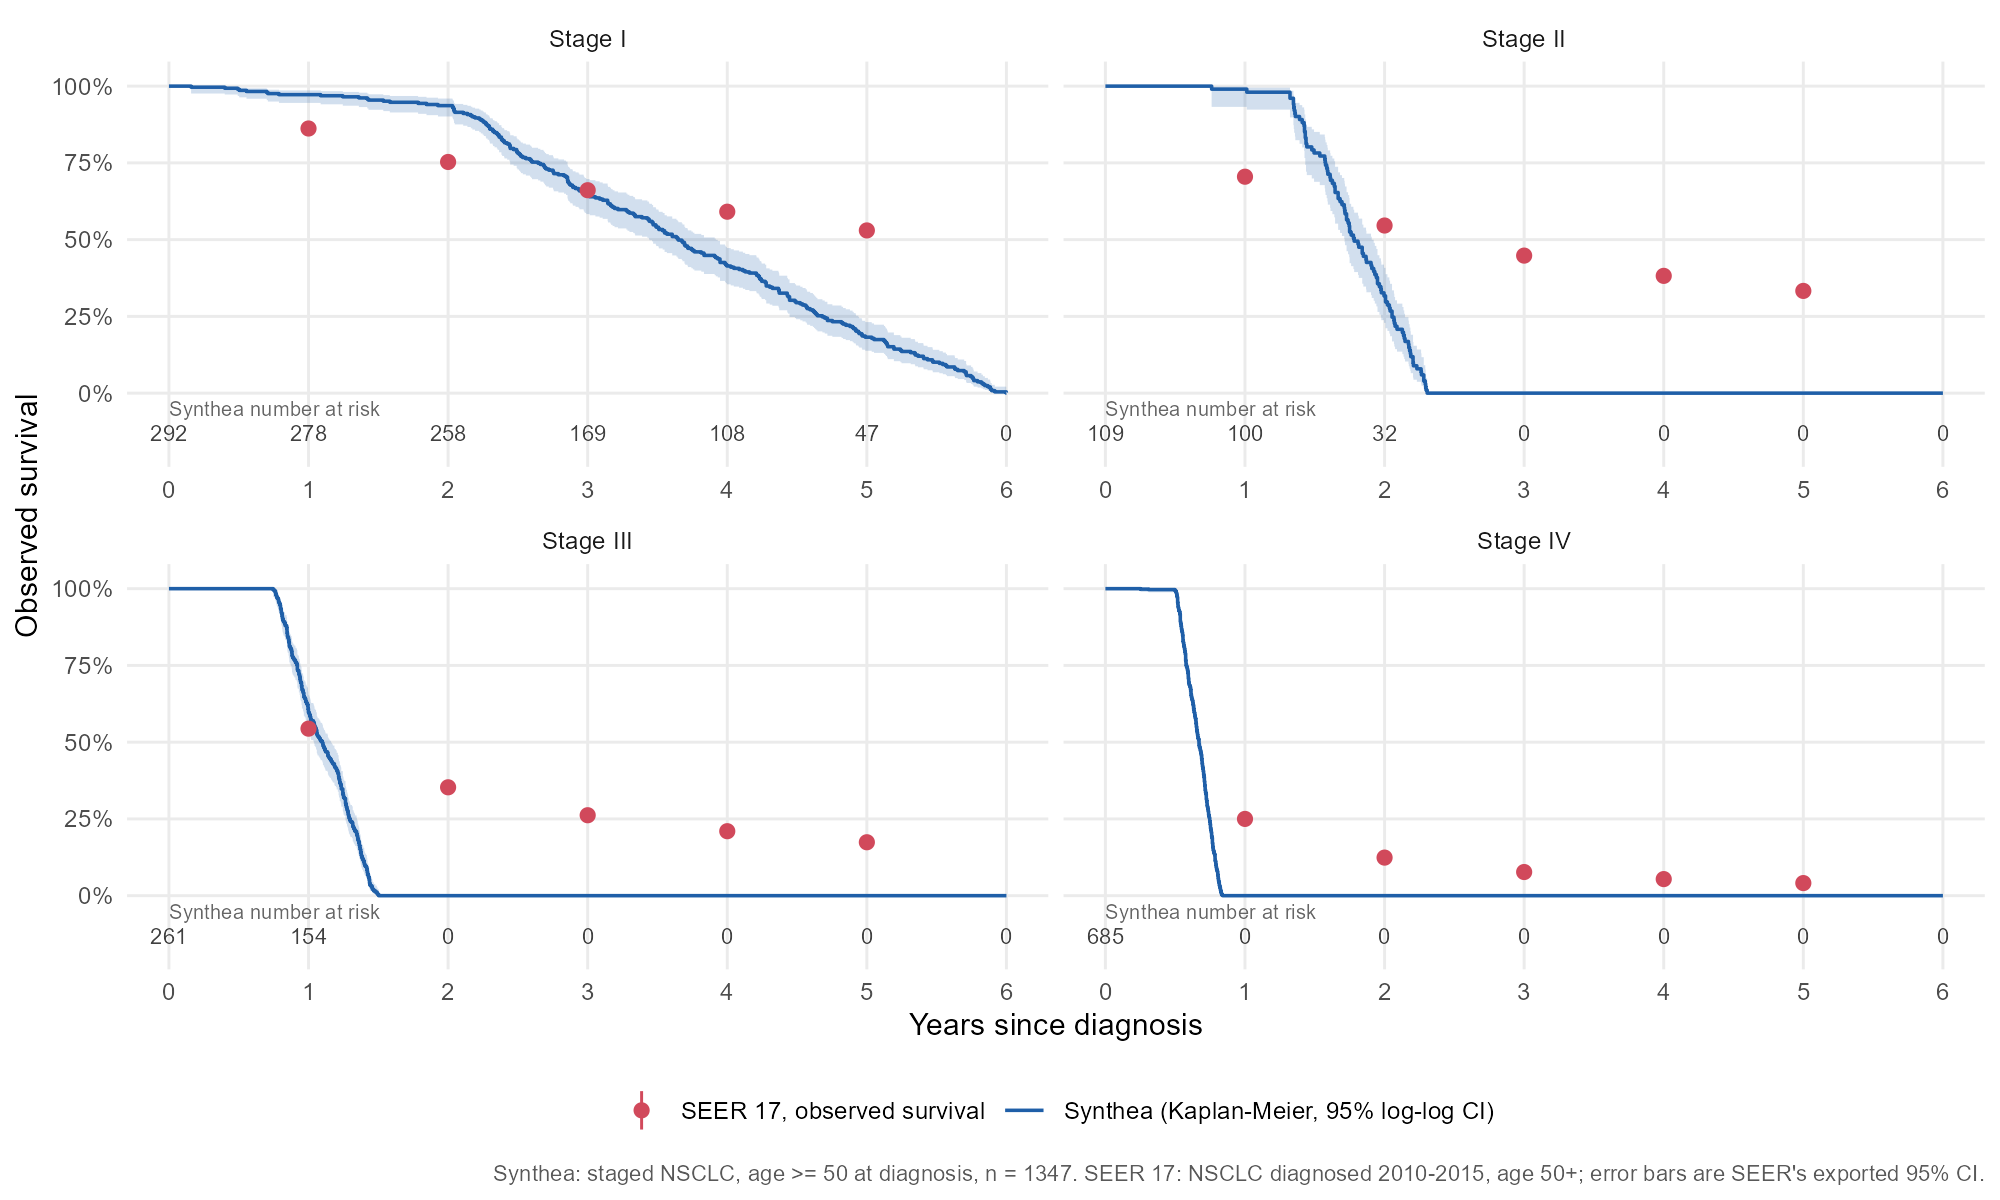
The medians matched. The survival curves didn’t.
How realistic is synthetic EHR data for oncology research? I built a lung cancer (NSCLC) survival pipeline on synthetic patient records and benchmarked it against 172,582 real U.S. patients from the SEER cancer registry.
Key findings
Stage III median survival, synthetic vs real. On medians alone, the synthetic data looks realistic.
Stage I five-year survival. For stages II–IV, synthetic survival is 0% at five years against 33%, 17% and 4% in SEER.
Synthetic patients received the same first-line treatment, so treatment effects cannot be studied at all.
The evidence
What I did
- Harmonized synthetic EHR records into the OMOP Common Data Model and built the NSCLC cohort, lines of therapy and real-world endpoints as tested dbt models.
- Compared survival with Kaplan–Meier, Cox models (with proportional-hazards tests) and restricted mean survival time, and reweighted to SEER’s age and sex mix.
- Checked data quality with the OHDSI Data Quality Dashboard and source-to-target reconciliation.
Data issues found along the way
A stage bug in the simulator
Unmodified Synthea put every lung cancer in stage I. Even after a first fix, a second module left half of them there. Both had to be patched before any comparison was possible.
A vocabulary mapping error
In the current OMOP vocabulary, the SNOMED code for stage III NSCLC also maps to small cell carcinoma. A cohort built on standard concepts would misclassify 312 patients. The standard data quality tool did not catch it.
The lesson
Validate full distributions, not summary statistics. Medians and restricted mean survival looked close for some stages; only the full curves showed the synthetic data cannot stand in for real-world outcomes. It is useful for testing a pipeline, not for benchmarking results.
All data are synthetic or public SEER aggregates; no real patient-level data and no Flatiron data are used. This is a methods demonstration, not clinical evidence.
I used AI assistants as tools for code and documentation; the study design, methods and interpretation are my own, and I verified all results.